
Welcome.

This course delivers some serious red pills on:
- What is energy and why is it so important?
- What are the main problems we’ll face in the 21st century as a result of our growing energy consumption?
- How can we resolve these problems?
(The bold sections are the ones I cover in this post, part II is also up, so is part III)
The lecturer is Jean-Marc Jancovici, an old-timer in the world of climate & energy consulting/analysis/commentary, and engineer by training. He’s gained quite a following in France (including a Facebook group full of dank memes from his fans 👌) and did not disappoint. He’s very detailed, first-principles driven and follows data not narratives or hype. The course is sadly only in French… but don’t worry here’s my summary 😉
1- What is Energy?
Energy = comfort
- Energy is the unit of measure of how much we are transforming our environment
- Using energy = putting machines to work. Machines have been:
- Other beings: animals, slaves
- Renewables: wind, water (Antiquity onwards)
- Fossil fuels: coal, petrol (last 1000 years)
- Today we are all Ironman. Each have the equivalent of 200 people working for each of us (in terms of energy output). That’s the global average, French average is 600…
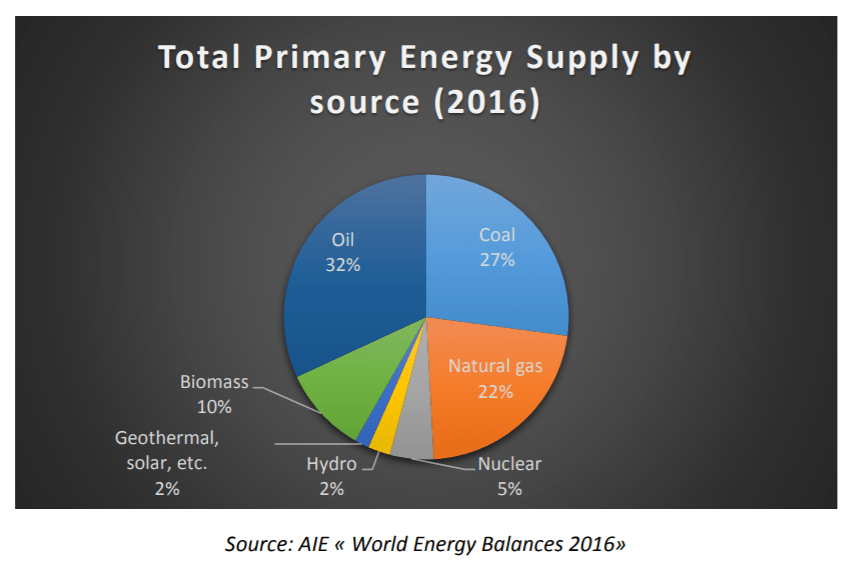
- In the modern era, explosion of our energy use driven by fossil fuels (oil, gas, coal):

- Energy = comfort. Completely transformed our societies from majority in the fields to majority in service sector, introduction of holidays, leisure time, etc.
- Enabled the population to grow 10x in 200 years
Why Oil
- Incredibly energy-dense:

- Liquid and very dense so to easy store & transport
- In 100 years, the price of a kWh has been divided by 100x thanks to oil
- US led the use (and exploitation abroad) of oil and it propelled it to the biggest power in the world. But for 2000 years China was the biggest, only displaced recently by oil.
- In general the more modern the transport technology, the more energy it uses. Paris – New York return is 400L of oil, big bathtub
GDP = Energy
- GDP per capita has proven to be extremely well correlated to energy use per capita. Here shown vs CO2 which is a proxy

- The more consumption there is, the more machines are needed to fulfil it, and therefore the more energy use there is
First Signs of Limits

- First oil shock in 1973 opened the question of oil reserves finiteness
- 1975 – 2000 global energy use per capita was actually flat. GDP growth maintained nonetheless thanks to (1) debt, (2) population still growing
- From 2005 in Europe energy use per person decreasing.
Summary
- The incredible rise in living standards and 10xing the population in last 200 years is thanks to growth, which itself is thanks to plentiful energy
- We are now starting to see the limits to this growth via the limits of energy resources (and global warming)
2- Fossil Fuels
Our Dependence
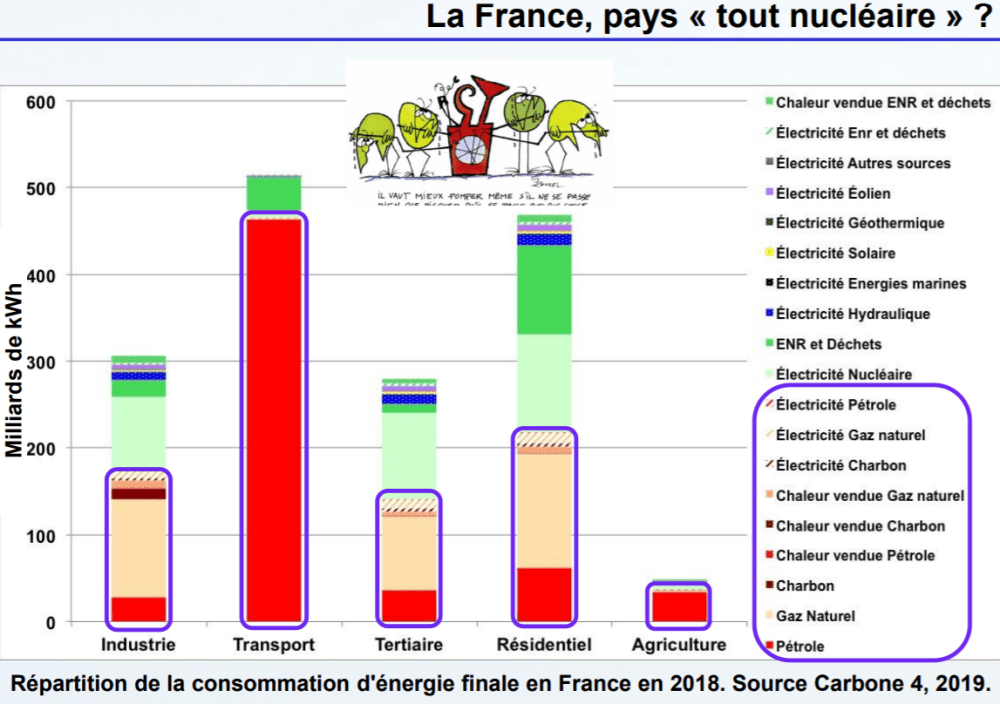
In France, even though electricity is largely “decarbonised” with nuclear, fossil fuels are still dominent for industry, transport, heating:
- Oil is global. Easiest to transport. 60% of oil consumed crossed at least 1 border
- 98% of anything that moves (transport) is powered by oil
- Gas is regional. Need to liquify to transport. Only 30% crosses a border
- Coal is national. Only 10% crosses a border. Mostly used to produce electricity
- If you don’t have coal reserves or gas nearby, you are dependent on oil. So global growth is dependent on oil.
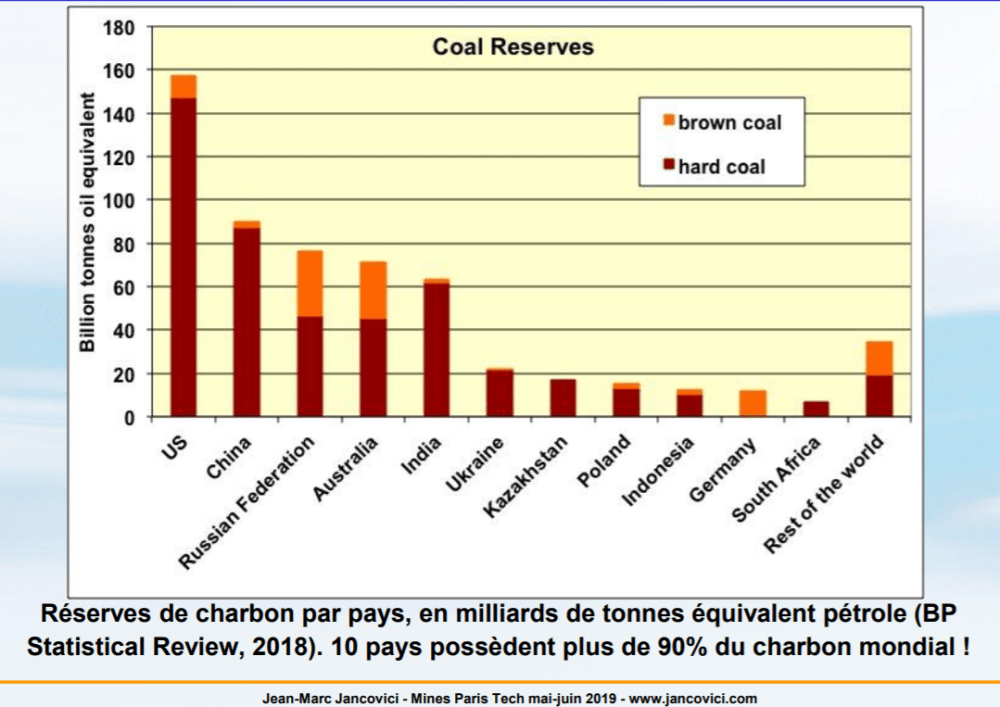
- Yet only 10 countries have 90% of the coal worldwide
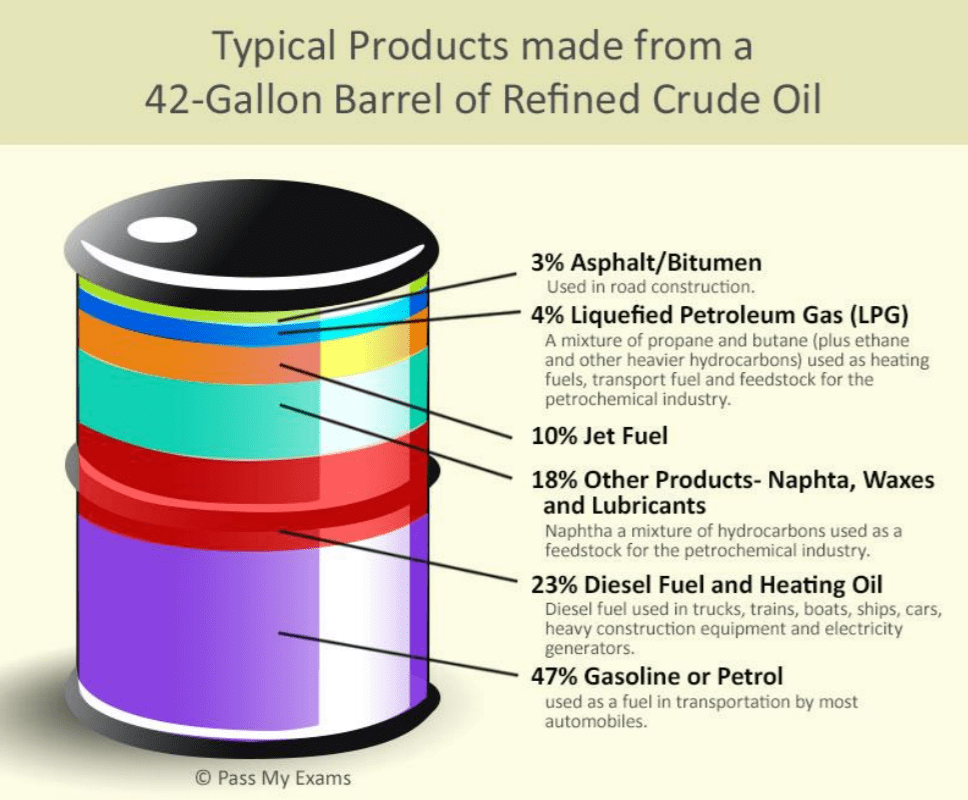
Oil Uses
Oil Reserves
- Conventional vs shale oil. Shale oil is at >500m depth and much more costly to extract, blocked from going up so need to fracture around it.
- According to the IEA (International Energy Agency) the conventional peak was in 2008. Conventional extraction is slightly down from that peak (2.5%)
- OPEC (Organization of the Petroleum Exporting Countries)
- Iran, Iraq, Kuwait, Saudi Arabia and Venezuela.
- These countries were later joined by Qatar (1961), Indonesia (1962), Libya (1962), the United Arab Emirates (1967), Algeria (1969), Nigeria (1971), Ecuador (1973), Gabon (1975), Angola (2007), Equatorial Guinea (2017) and Congo (2018).
- Cartel assigning quotas of production to stabilise price
- Liar’s poker: countries always reporting their reserves up to be able to produce more. The large majority of reserves are visible to national actors, not private, so very little transparency
- Global production is still up from shale oil boom started in 2007 driven by US. However
- Investors losing money on shale oil
- Shale reserves estimated to be ending in 2027?
- Increasing dependence on shale oil to maintain growing oil production
- Oil found is not necessarily usable. Can be very expensive to get out or at very low throughput, eg most of Venezuela’s reserves
Gas
- Peak production estimated 2030-2040
- Japanese pay the most for liquid natural gas (Japan has no fossil reserves)
Interesting Geopolitical Impacts
- In 1900 UK had highest coal production per person of all time (more than China today)
- Russian imports to Europe: Nordstream 1. Likely geopolitically that Russians will export more and more to China, equidistant
- China push on electric cars was to go from imported petrol to domestic coal
- Apparently Pearl Harbor was driven by Japan wanting to get Indonesia oil reserves (they were very dependent on US oil) and had to attack US bases
Summary
- Today global economic growth depends on oil
- Oil & gas resources are finite, we have hit peak production and are getting diminishing returns
- If we don’t manage to wean ourselves off them, there will be a big reckoning when we run out
3 & 4- Climate Change
Timescales
- 10k – 100k years scale: climate dominated by astronomy. Changes to our orbit, changes to our inclination which impacts strength of seasons
- 100-1000 years scale: geological & ocean impacts. Continental drifts, volcanoes, surface of Earth becoming more/less reflective
- Weekly-years scale: atmosphere, and therefore anthropic impact
Greenhouse gases
- Are able to absorb infrared coming from the Earth
- Water vapour (H2O)
- Carbon dioxide (CO2)
- Methane (CH4)
- Nitrous Oxyde (N2O)
- Halocarbon compounds (eg C2FCl5) – includes refrigerants
- Ozone (O3)
- Without the greenhouse effect Earth would be -18C, it’s a natural process
- But our emissions are adding an additional “anthropic” effect

- Greenhouse gases stay a long time in the atmosphere. If we stopped today, in 100 years 40% of the anthropic origin CO2 would still be there, 10% in 10,000 years
- We measure historic CO2 levels from ice core samples where bubbles have trapped the air from back then

Emission Sources
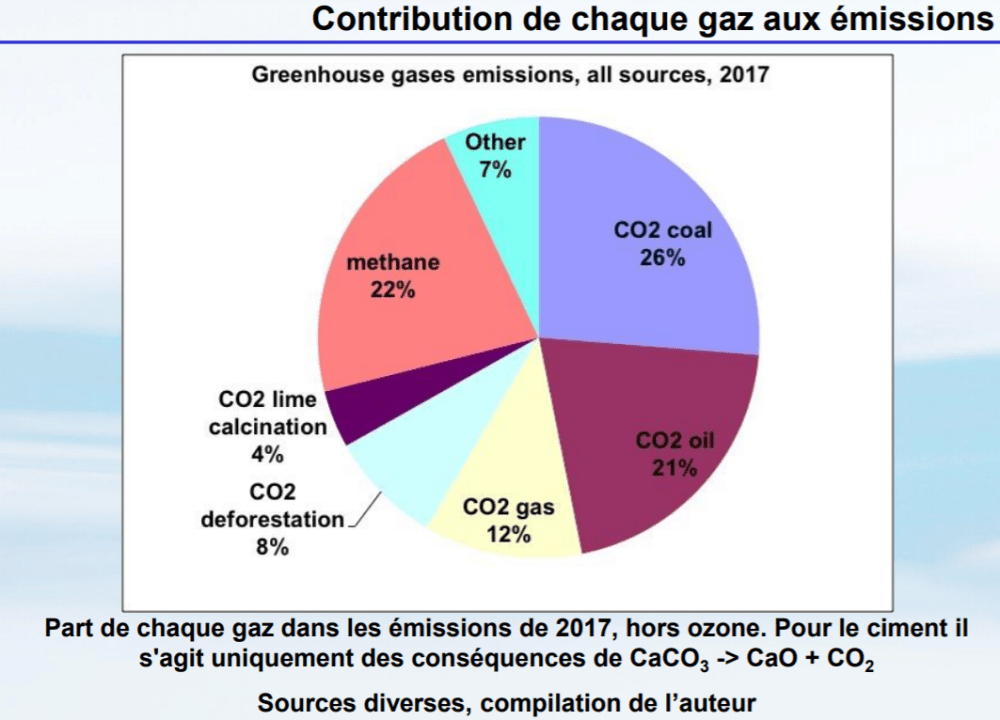
- Within CO2 oil, cars are about 30%
- About 50% of methane is livestock. Other sources: mining, landfills, biomass burning, rice paddies
- Nitrous oxyde: 70%+ is from fertiliser
- Halocarbon compounds: CFCs were burning Ozone layer, replaced with others. Used for refrigiration, solvents, etc

Global warming
- In the last 800,000 years, the fastest temperature rise has been 1C in 1000 years
- In 2019 we are already 1C above the average temperature from pre-industrial years (average 1850-1900)
- The rise is too fast for many ecosystems and species (fauna and flaura) to adapt
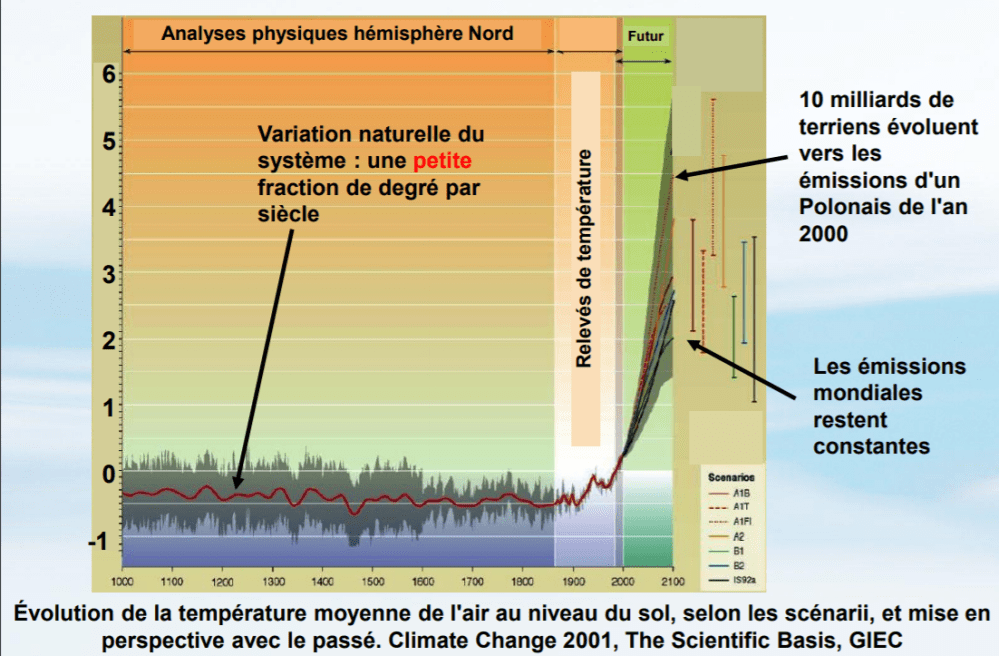
- Remember that modelling is probabilistic, complex systems, no certainties. Often we talk about “most probable” warming but more extreme warming possible within same models
- Often models don’t take into account that economy will likely slow due to climate
- “Global Warming Potential”: a metric to equate all gases to an equivalent in CO2
Impact
- Acidification of oceans -> marine life destruction
- Warmer water expands -> sea levels rise
- Sea levels rise -> submerged cities, ports
- Ice melting -> sea levels rise, possible melt of permafrost “protecting” methane
- More intense precipitations -> fauna/flora destruction
- Droughts -> lower agricultural yields
- More hot days -> lower agricultural yields (photosynthesis stops if too hot)
- Hotter average temperature -> more pathogens
- Example already with El Nino leading to more cholera
- + more things we can’t predict

- Mediterranean estimated to be very affected – lower precipitations. Will impact yields.
- Example already with Syria (from my notes on the Bill Gates book: “Worst drought ever recorded in Syria – 2007 to 2010 – 1.5M people left farming areas for cities, set stage for the conflict. 13M Syrians displaced.”)
Targets

- What would it take to hit the RCP 2,6 scenario?
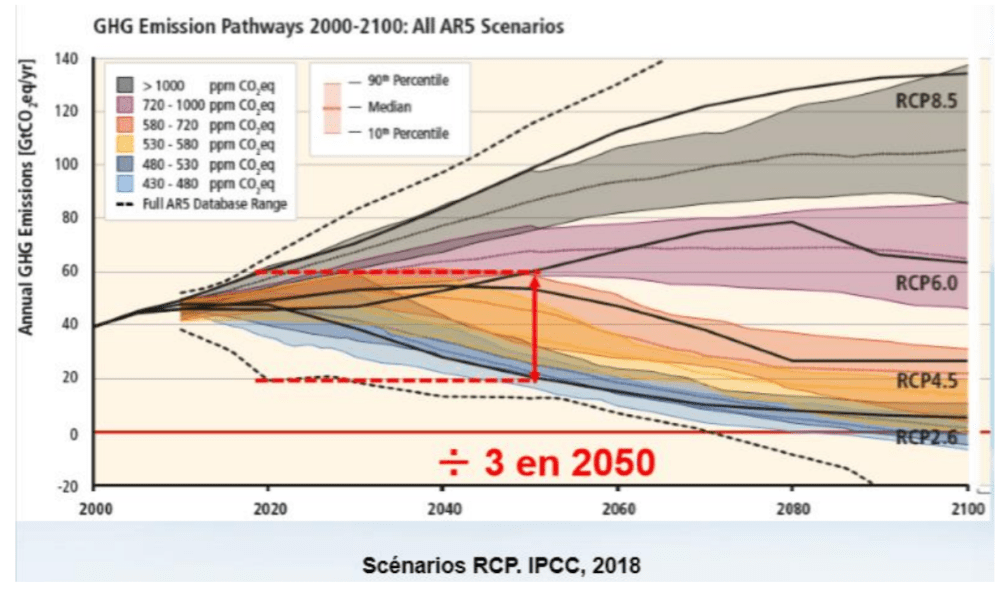
- We’d need to reduce by 45% by 2030 and divide by 3 by 2050.
- Would be 2T CO2e for each 9B human. Today French person is at 12T CO2e
- The graphic shows the huge inertia in response (eg in 2050 there is only a 1C difference between scenario 6 and 8.5)
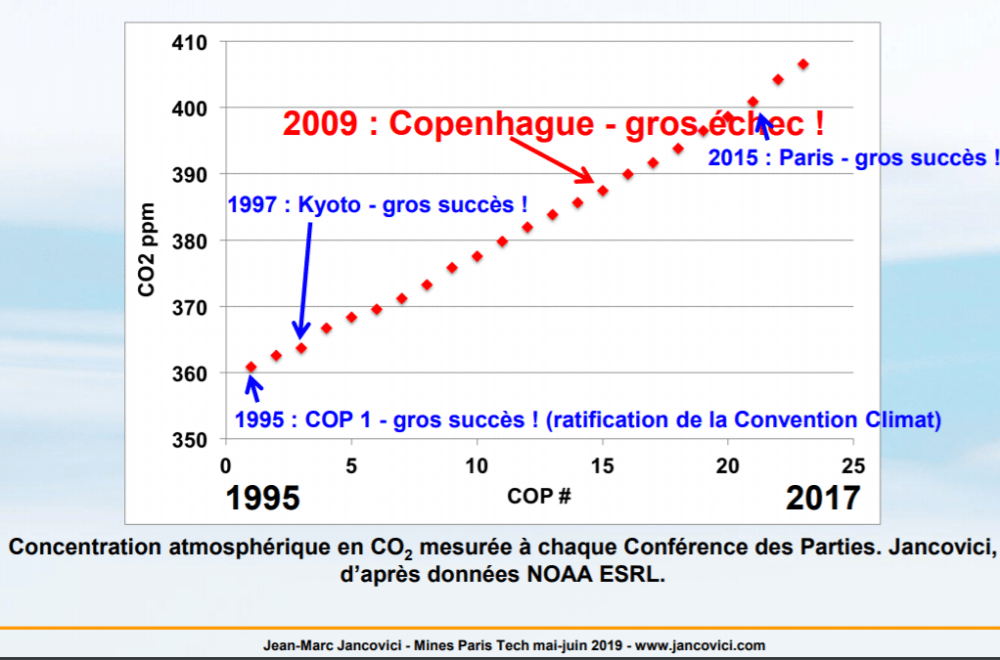
Talk is cheap
Summary
- To keep warming to 2C we will need to reduce global emissions by 3x by 2050
- Warming above 2C will likely lead to huge crises: famine, ravaged ecosystems, mass displacements etc
- A huge part of our adaptation capacity today is thanks to our plentiful energy. Unsure how well we could adapt if resources run out
- There is huge inertia. What we are doing now is really for our kids and grandkids. 2040 temperature rise is already baked in
Summary of Part I
- Energy has propelled us to comfortable lives in the service sector, with holidays and leisure time
- 80%+ of this energy is from fossil fuels
- Houston, we have 2 problems:
- We are hitting diminishing returns on extracting these fossil fuels, and their reserves are fininte
- The exploitation of these fossil fuels causes global warming which threatens our ability to feed the planet and avoid mass population displacements
😰
Stay tuned for Part II which will cover what we can (try to) do to reduce emissions by 3x by 2050. (Now posted 👉 here)
Resources
All the below in French:
- Youtube playlist (20 hours) – audio only
- Slides
- Resumé du cours (30 pages, en Francais) <– highly recommended

[…] Completed the course, published notes Part I, not yet Part II. […]
LikeLike
[…] yourself in Part I if you missed […]
LikeLike
[…] Part I […]
LikeLike